The modern world revolves around data and information. The sources of data are so abundant nowadays, and they have become a valuable resource.
Yet, not all available data can help you build outcomes. You need the tools to analyze data and use it more effectively. It’s also the primary duty of data analysis methods.
How can they extract and take advantage of data? What methods do the data professionals use? I will give you a detailed list in this post.
Keep reading this post to find out!
What Is Data Analysis?
It is the practice of analyzing data to sort out useful information. These results can help you form effective strategies and decisions.
There are many tools that help you harness the value of information. A typical process starts with identifying the problem. Then, you will collect data related to that area and analyze it.
The tools will then help you identify new trends or correlations. Finally, you will use these results to make informed decisions.
Data Analysis Methods
These methods involve complicated tools and processes to perform. I will try to explain them in a simple way. There are also realistic examples to help you visualize their features better.
1. Using Statistics
Statistics are an excellent tool for collecting data. It also effectively represents the outcome. They allow you to understand information in a much shorter time.
Statistics are more than just facts and numbers. It contains an array of knowledge that conveys meanings to users. This feature is vital since data is so abundant in the modern era.

2. Grounded Theory
Grounded theory is different from the standard research methods. Its main target is to develop theories using various sources of data. In real life, the data analysts will use a combination of tools to collect data first.
Then, they develop theories that are closely related to the research. For example, a department may conduct a survey to research employee morale.
They will ask each employee specific questions. After collecting the results, they can determine the factors that affect their morale.
3. Decision Trees
This algorithm is very popular in data mining. This diagram features a shape similar to a tree. Each branch of the tree features a classification or area of data.
This model helps you divide data into many smaller parts. It can carry both values and instances. Meanwhile, all of these parts are closely related as they belong to the same tree.
Building a decision tree also takes minimal effort. It is very easy to understand. You can use this tool to know how one choice can affect the other decision.
4. Visualization
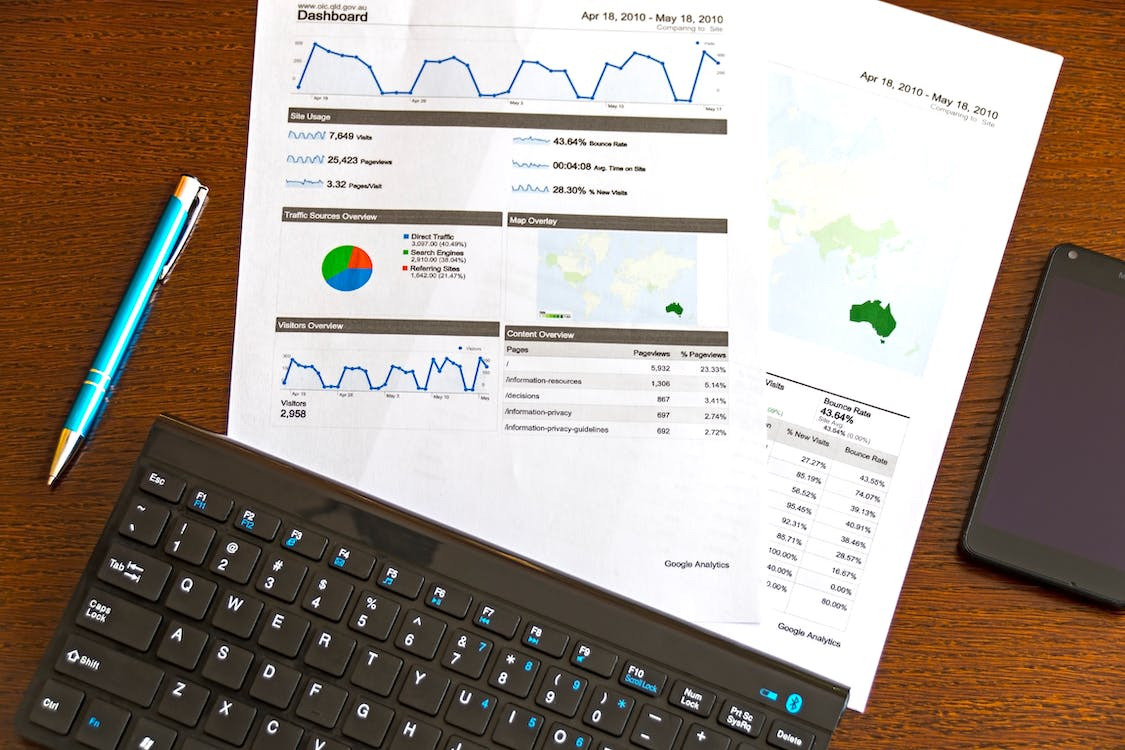
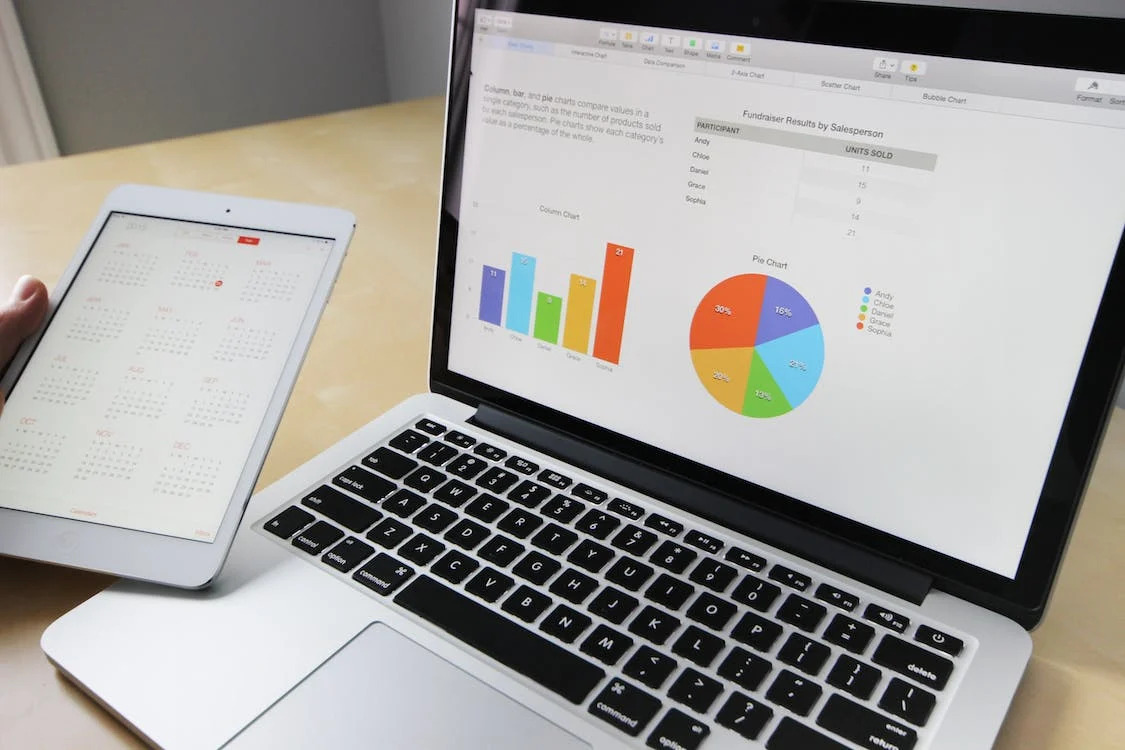
The most popular format for data is a combination of text and numbers. This format takes a lot of time to analyze. To solve this problem, you can convert them into simple visualizations.
Some popular tools for this method are histograms or charts. These images can convey ideas better than plain text.
They can organize complex ideas and make them easier to understand. Thus, you can capture the key meaning of a large database with minimal effort.

5. Machine Learning
Dealing with a vast volume of data is frustrating. Human errors can also ruin the outcomes of data analysis. Using tools can eliminate these problems.
The data analyzing tools can extract a vast volume of data from multiple sources. It has algorithms to identify the most accurate areas. Also, experts can quickly modify the tools to achieve their desired outcomes.
6. Time Series
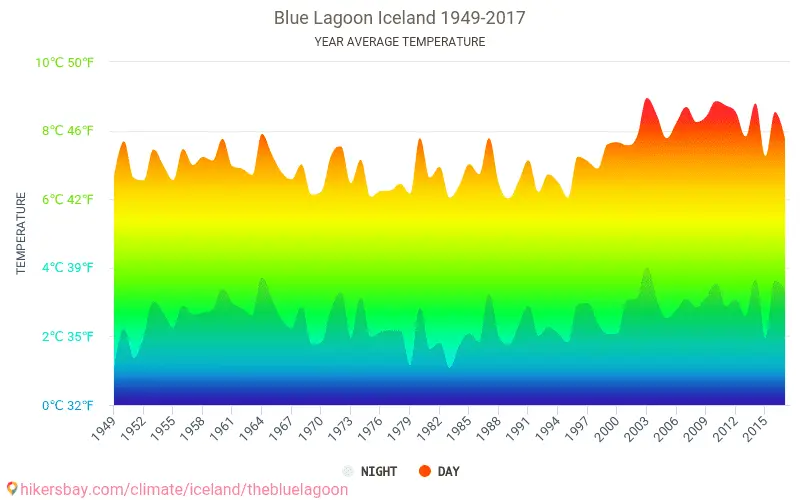
Data will accumulate over a long period. The experts will collect information from these events to analyze them. This method is called time series analysis.
With this method, you can monitor how subjects change over a period of time. It shows how the data modify itself and form the final result. The more data points you use, the more accurate the results.
The potential of this method is much higher than traditional line graphs. Organizations can use this tool to spot the trends. They can keep track of the seasonal trends and predict when they will occur.
7. Text Mining
As its name suggests, this method revolves mainly around texts. The experts will transform the random text into insightful information. There are many tools and machines that help them perform this task.
Dealing with a large amount of text is both an opportunity and a challenge. This method allows you to classify texts into organized pieces. For example, you can use the customers’ comments as a data source.
Then, you will classify them into negative and neutral types. You can also identify words that appear frequently in these comments. Thus, you can learn more about customers’ thoughts and the trends they like.

8. Data Mining
You will need a large batch of information to conduct this method. From this huge data volume, you can extract valuable information. It will help you identify beneficial patterns for specific purposes.
For example, companies can use this method to learn more about their customers. They can research customers’ ideas on a certain product. Then, they can identify the most common thoughts they have about that product.
From this outcome, the company can find effective ways to improve that product quality. It helps them decrease costs and enhance product sales.
9. Network Analysis
This method helps you identify the relationships between many subjects. The relationships can be family ties or friendships within a classroom.
Another example is how devices like computers or phones connect with each other. It can also be the cells contained in the human body.
These relationships will create a network. Then, you can figure out how this network functions as a whole. It will help you find ways to improve the network’s function.
10. Statistical Modeling
This method helps analyze large pieces of data using statistical strategies. Then, you can develop a model based on the results. A model contains various components, which can be random or organized.
For example, you can build a model of a large living area. This model contains factors like neighborhoods, trees, and forests. The model shows the number of these components and their positions.
Thus, you can gain more insights into the weather and conditions of that area. You can also locate areas with ideal living conditions for the local dwellers.

Final Thoughts
Data analysis methods in this list have unique advantages and setbacks. The key is to pick a tool that suits your professional needs. I hope the provided examples can give you more insights into how these methods work.
Thank you for your time!
