Statistical distributions are special tools that help us make sense of data. In this post, we’ll explore 7 vital types of statistical distributions.
By learning about them, you can analyze data better. So let’s dive in and explore each type in simple terms to see how they can help us make sense of the numbers around us!
What is a Statistical Distribution?
A statistical distribution describes how data is spread out or organized. It helps us know the patterns and chances of different values or outcomes.
Hence, we use it to analyze data, make predictions, and know the likelihood of different events. It helps us see the big picture and make sense of data.
Currently, many types of statistical distributions are in our life. Here are the most common types:
1. Normal Distribution

The normal distribution is a commonly used pattern in many areas. It forms a bell-shaped curve, where most of the data is around the middle and gets less common as it moves away from the center.
The main things to know are its average (mean) and how spread out the data is (standard deviation). These two numbers define the shape of the curve.
Besides, it has some features. First, it is smooth and can have any value within a range. Second, it is symmetrical, so the average, middle, and most common values are the same.
2. Poisson Distribution

The Poisson distribution is a way to know how often rare events happen. Poisson expresses the probability of an event occurring in a fixed period of time or space. Poisson is used to model random events.
For example, it can help you count the number of emails received in a day, accidents in a week, or the number of phone calls received in a given minute.
Besides, it assumes that the events happen independently and at a steady rate. Thus, it gives you the ratio of different numbers of events within a time frame.
Regarding usage, it is helpful in many areas, like predicting rare events, waiting times, or analyzing data in fields like insurance.
3. Binomial Distribution

The binomial distribution helps you know the chances of getting a certain number of “yes” outcomes when you repeat an action a fixed number of times.
Thus, it is helpful because it gives us the ratio of different results when there are only two chances, like success or failure.
Imagine flipping a coin 10 times. This type can tell you how likely it is to get a specific number of heads, like 3 or 7.
Today, we use it in many fields, like quality control, genetics, and surveys, to predict the likelihood of getting a certain number of successes.
4. Exponential Distribution

The exponential distribution is a pattern that helps you know the time it takes for something to happen. So it is often used to show events that occur randomly over time.
The notable thing to know is that it focuses on the time between events. For example, if a bus arrives every 10 minutes on average, you can predict the chances of waiting 5 or 15 minutes for the bus to come with this type.
Besides, it has a few vital features. First, it is continuous. In other words, it can take any value within a range. Second, it is often skewed, meaning the probabilities are more likely to be on one side.
5. Uniform Distribution

The uniform distribution shows how likely it is to get different outcomes when each has an equal chance of happening. In other words, it’s like rolling a fair, six-sided die.
People use it in random number generation, games of chance, and sampling. In this distribution, all the outcomes are equally likely. For example, when we roll the die, each number from 1 to 6 has the same chance of showing up.
Features are simply because every outcome has an equal probability. Also, it is flat or even, like a level line, because no result is more likely than another.
Moreover, it can describe cases where things are chosen randomly, like picking a colored ball from a bag with equal numbers of each color.
6. Beta Distribution

The beta distribution shows probabilities or chances. For example, it can help you know the ratio of a plant growing to a height between 0.3 and 0.6 inches.
Besides, it is flexible and can take different shapes, like curved or straight lines. Also, it only deals with values between 0 and 1.
In addition, it can model things like success rates or proportions. Thus, it is popular in many areas, like analyzing biology, economics, and quality control.
7. Chi-Square Distribution
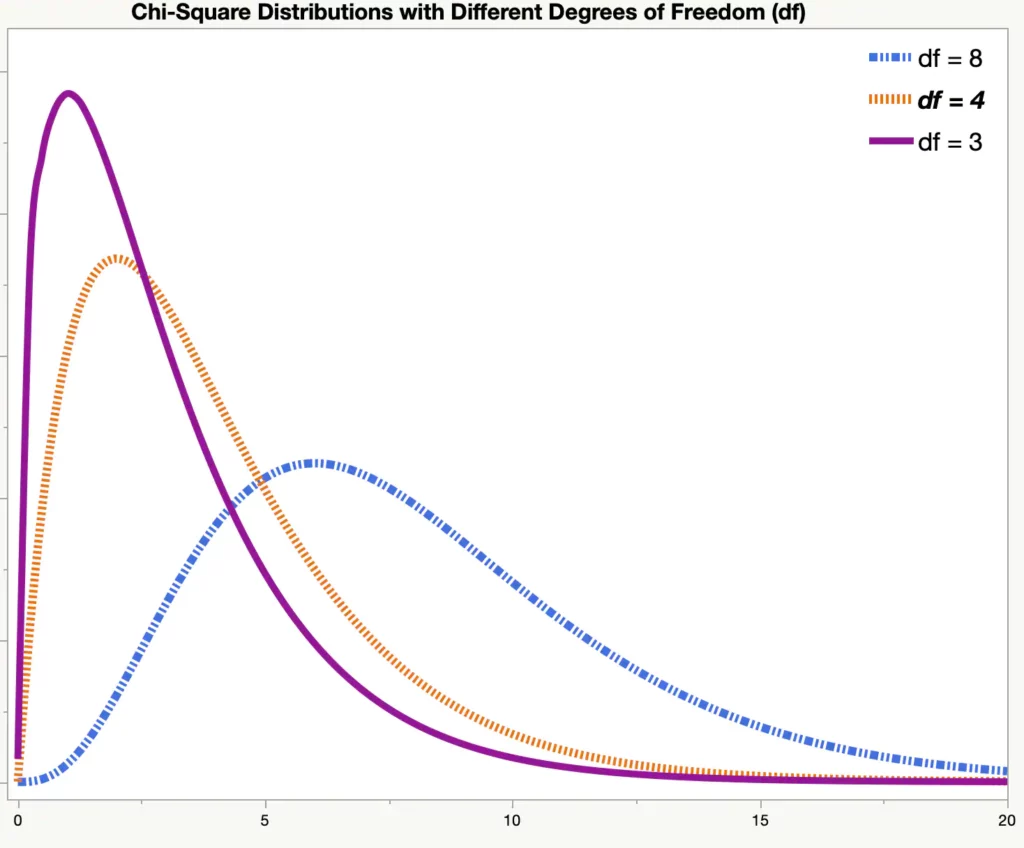
The chi-square distribution is helpful when you compare observed data to what we expect. It’s like checking if the number of boys and girls in a class is what you would predict.
Thanks to its features, we use it in many areas, like analyzing survey results, genetics, and quality control. Hence, it helps us see if the data we observe differs from what we expected or if it is just a result of random chance.
Above are some of the statistical distributions today. One thing to note is that for different data and problems, you need to apply suitable types.
FAQs
How Do You Identify A Statistical Distribution?
You must analyze the data and look for patterns. Then, compare the data’s shape, central tendency (average), and spread to known distributions.
What Is The Most Common Statistical Distribution?
It is the normal distribution (the bell curve). It is widely used because many natural phenomena and real-world data tend to follow this pattern.
Why Is Distribution Vital In Statistics?
It helps us know the data’s characteristics, such as central tendency and variability. Also, it helps us describe and analyze data, enabling informed decision-making and analysis.
Conclusion
The above types of statistical distributions are helpful tools that help us understand data in many areas, such as biology, economics, and quality control.
You can better analyze data and predict by learning about these distributions. Then, you can become a data expert and use these tools to make sense of the numbers around you.
Thank you for reading!